Last week we launched a dramatic increase in performance for our front end. We are built on Backbone.js and, over time, our rendering times have slowed down. Luckily, using some of the great tools in the latest versions of Chrome and a few additional tools for instrumenting how the Sprintly frontend was performing, fixing it was dramatically easier than it would have been just a few months ago.
Analyzing the Refactor
After some initial testing of rendering times and analyzing performance data gathered with Caliper, we determined that the best way to get out from underneath lethargic performance with large item-sets was to rethink how item cards were being rendered throughout the app, with a focus on item columns. Item columns are containers for groups of item cards (stories, tasks, items and defects) and show up on the dashboard and items pages.
Item column views do a lot of heavy lifting in Sprintly, and since they were initially developed a myriad of features have been added, subtracted, balanced and adjusted, leading to optimizations for some scenarios but not others. We sped up item columns primarily by optimizing how item columns rendered and cached the individual cards that go into them—rather than re-rendering column contents when changes happen, cards are inserted, removed and re-rendered individually, leading to better overall performance everywhere item columns are in play.
Better Tooling
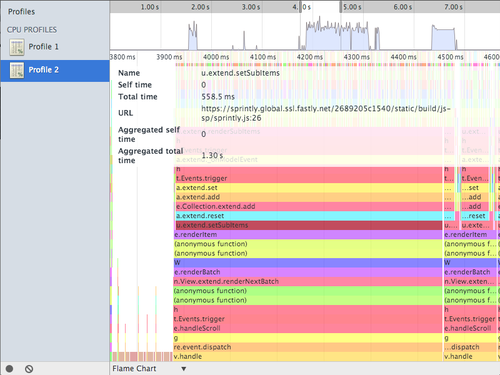
The new Flame Chart view for CPU profiling made it easy to spot and optimize areas in our app that needed a dose of micro-optimizations. Given that many of the performance enhancements focused on customers with the most items, relatively small improvements can have a big impact on the most intensive parts of the rendering stack: smooth scrolling / lazy-loading, resorting and switching between the dashboard and the items view.

The notion of JavaScript and browser rendering “frame budget” was a focus of the performance refactoring and much of the speed improvements can from recognizing when the Backbone application was attempting to do too much during a given frame. Actions that trigger rendering/repainting, requesting data from local cache or from the API or binding events to the DOM are common culprits when trying to improve framerate.

By using the timelines panel in the Chrome developer tools we were able to identify where bottlenecks were forming, and were able to move many rendering actions to be asynchronous, either by delaying them with a set timeout or a using requestAnimationFrame.
A big shout-out to Addy Osmani and his spectacularly titled blog post Taming The Unicorn: Easing JavaScript Memory Profiling In Chrome DevTools, which provided an excellent set of sign posts for wandering through the jungle of JavaScript heap dumps and CPU profiles.
It’s worth noting that while we were primarily measuring in the latest version of Chrome, there are good alternatives in the Firefox devtools, which we were consulting from time to time to make sure gains in one browser weren’t causing regressions in another.
Performance Monitoring and Measurement
We were able to consistently and accurate measure performance characteristics, which greatly influenced how we went about re-writing how item columns and item cards were being rendered to address these framerate, load time and rendering concerns.
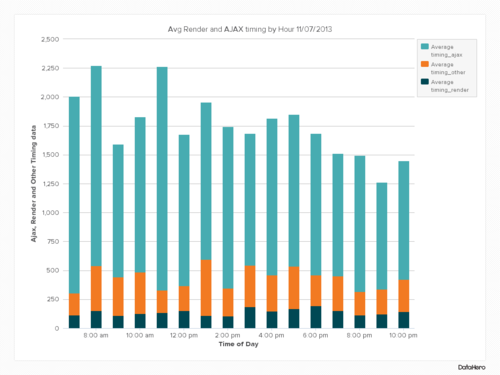
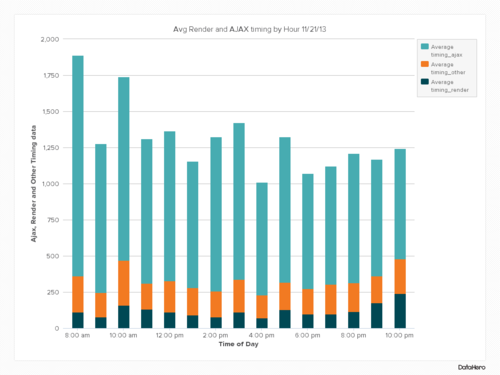
Here are some of the results that were measured using Caliper from before and and after the performance release:
Before the performance refactor:

After the performance refactor:

Following the performance release, average rendering time was decreased on average of 30%, with an 11% decrease in 90th percentile rendering time and a 6% decrease on the median response. We’re going to continue measuring and quantifying frontend performance—and still have more speed improvements in the works.
We’ve noticed palpable difference in performance and have been hearing the same from some of our customers already. Rob Munro, CEO and Scotch Aficionado of Idibon, told us “We stress-tested Sprint.ly over the last couple of days a few times with multiple people searching/browsing/editing all at once. It went really smoothly – thanks for the great product updates!!”
Let us know if it feels good for you too.
Thanks so much to Quick Left, our pals in Boulder who helped bring all this impressive JavaScriptiness together.
About Quick Left: Quick Left is a consulting agency of technologists and designers located in Boulder, Colorado. Quick Left specializes in building custom web and mobile applications through a transparent agile workflow process. Contact hello@quickleft.com for more information on project estimates, developer resources, developer training and UI/UX design. Follow @quickleft on Twitter.

